
Guide to the ConversionQA Change Report
In addition to a true/false result indicating successful conversion, ConversionQA outputs a HTML change report that can be viewed in the browser.
Example
Suppose you have a Word document that contains some content like this:
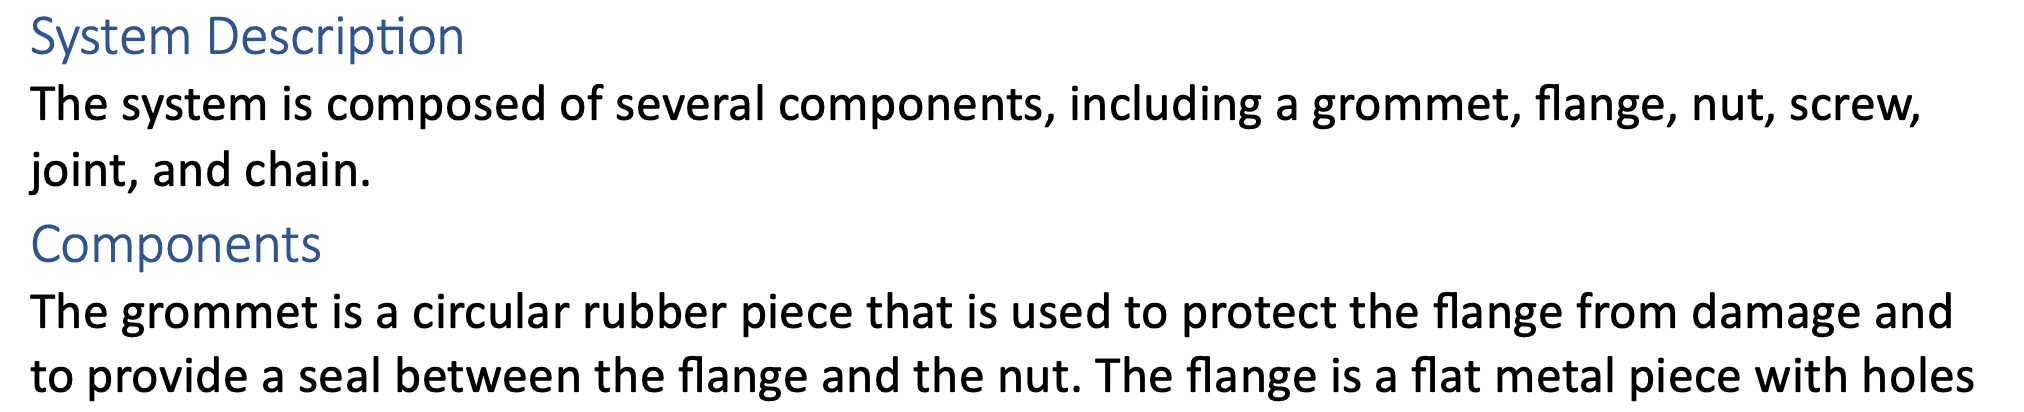
The document is put through an automatic conversion process that outputs a DITA document made up of a root ditamap and several dita files.
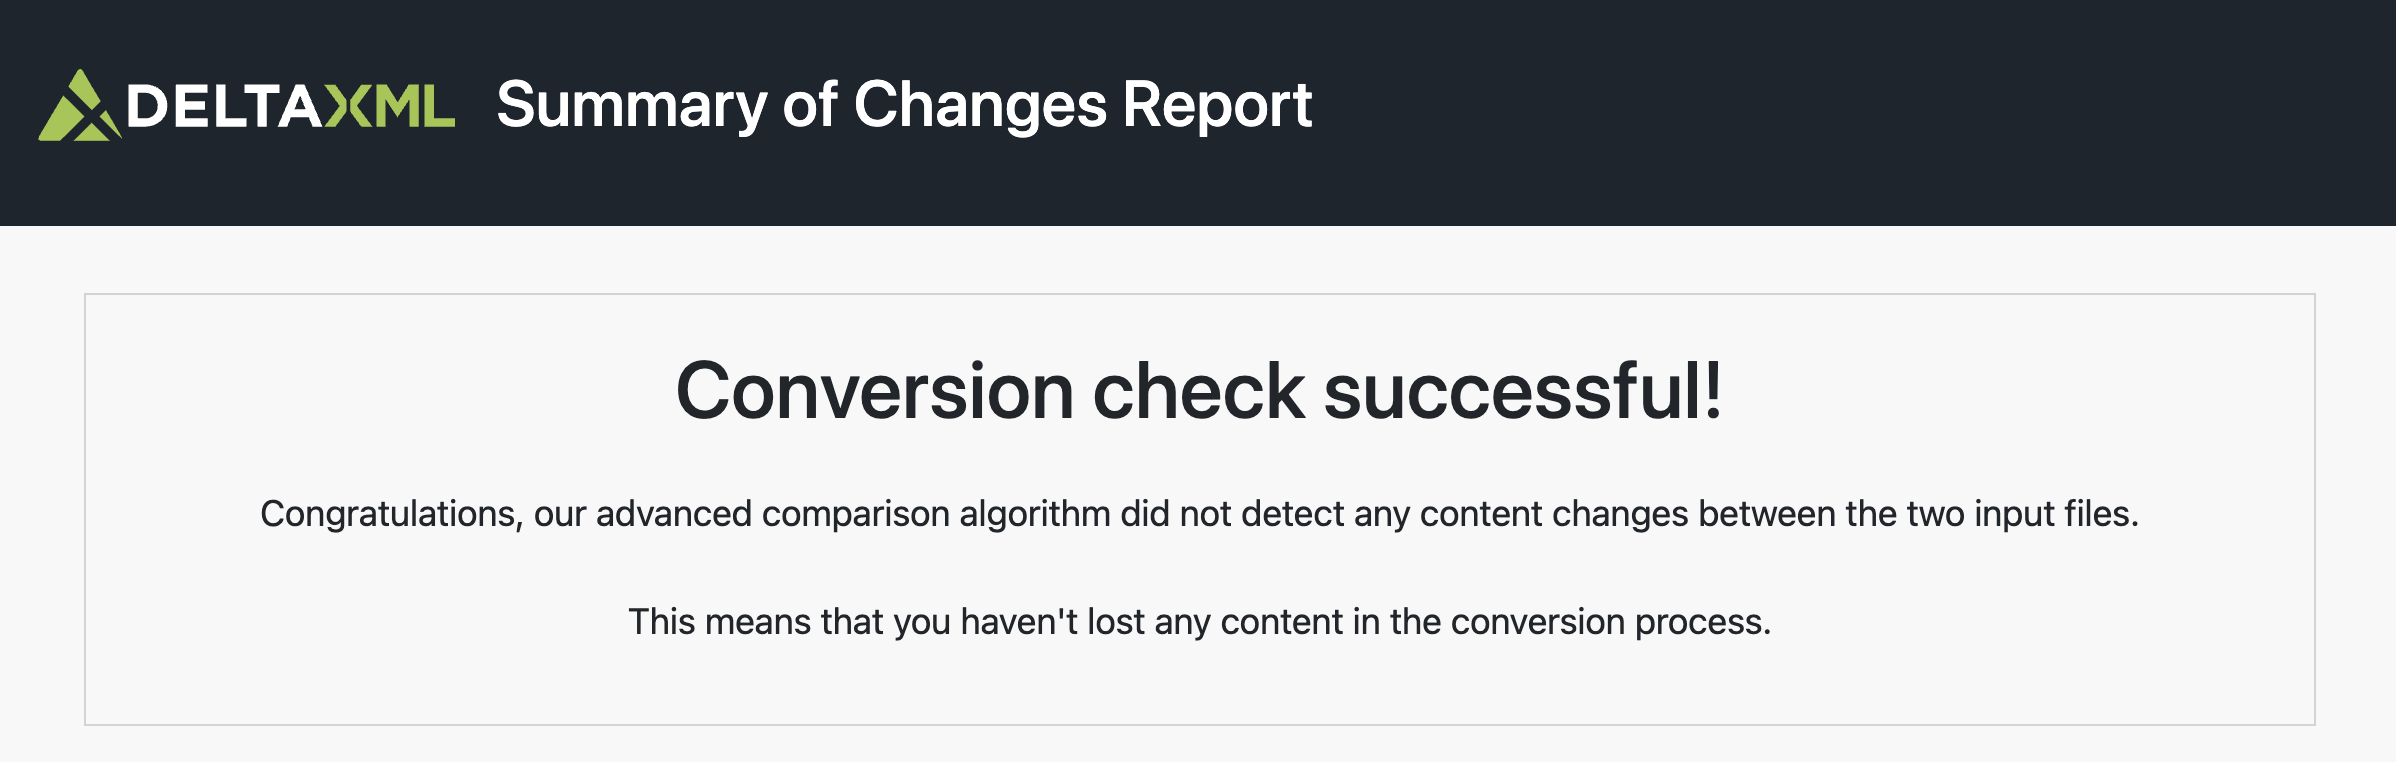
Report when ConversionQA Finds No Changes
If the conversion did not lose any content then ConversionQA will report a successful conversion and the summary report will look like this:
Report when ConversionQA Finds Changes
Suppose the process failed to convert the first heading line “System Description“, and output a DITA root map and DITA file that looked like this:
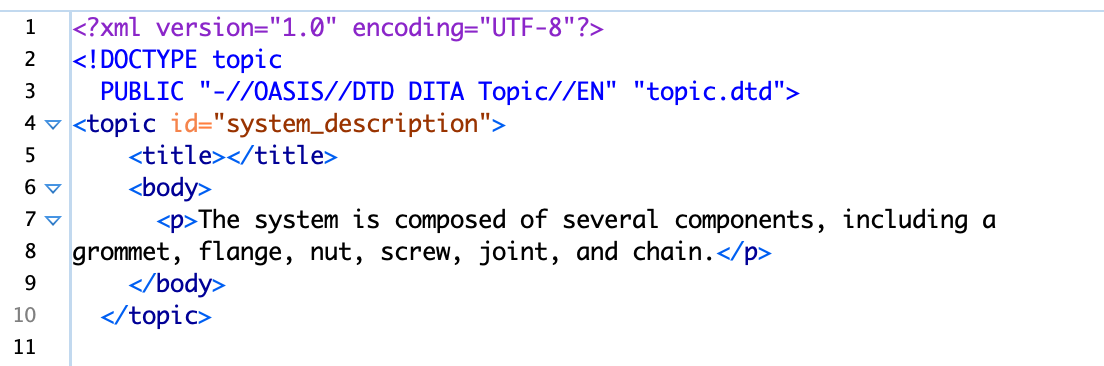
system_descrption.dita
Note the empty title element.
Now if you were to check the conversion quality using ConversionQA you would get a HTML summary of changes report output file that looks like this when viewed in a browser:
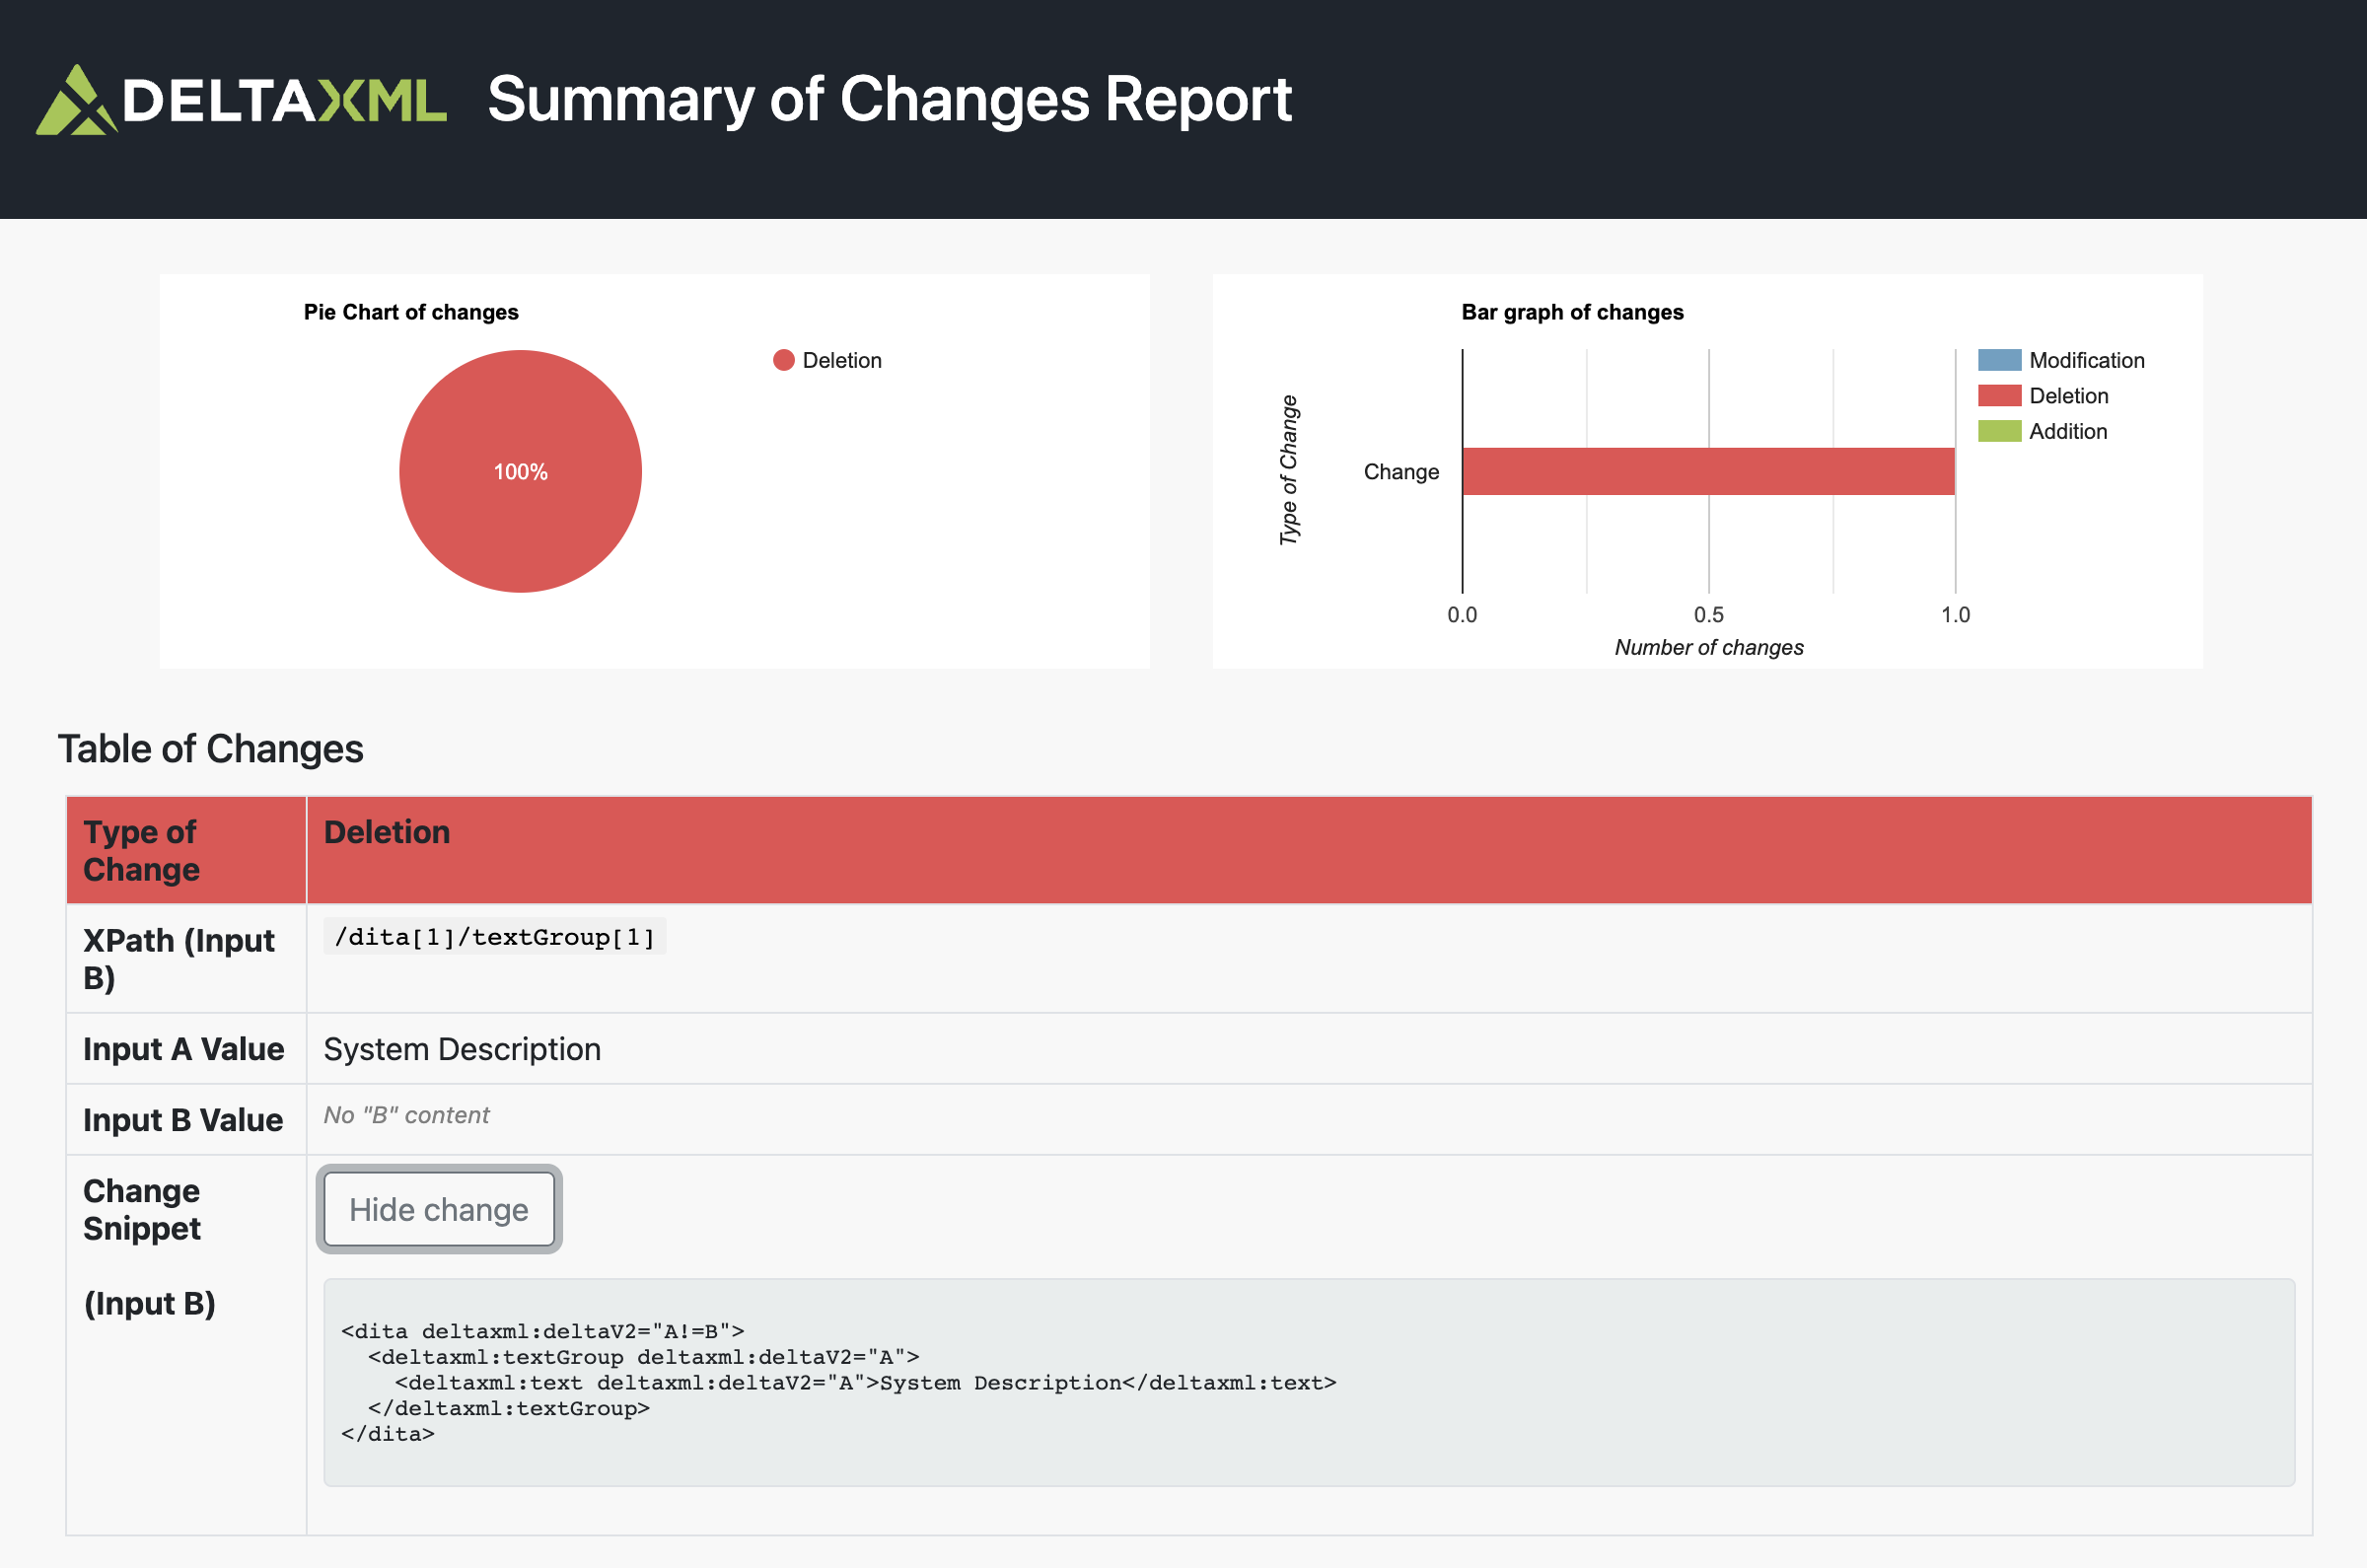
A Report of a Single Deletion
In this simple example a single change is correctly reported, which is the deletion of the “System Description” heading.
A Typical Change Report
Now suppose the resulting DITA document is corrected and then further edited and you want to see the changes compared with the original Word document, the output summary of changes would look something like the following:
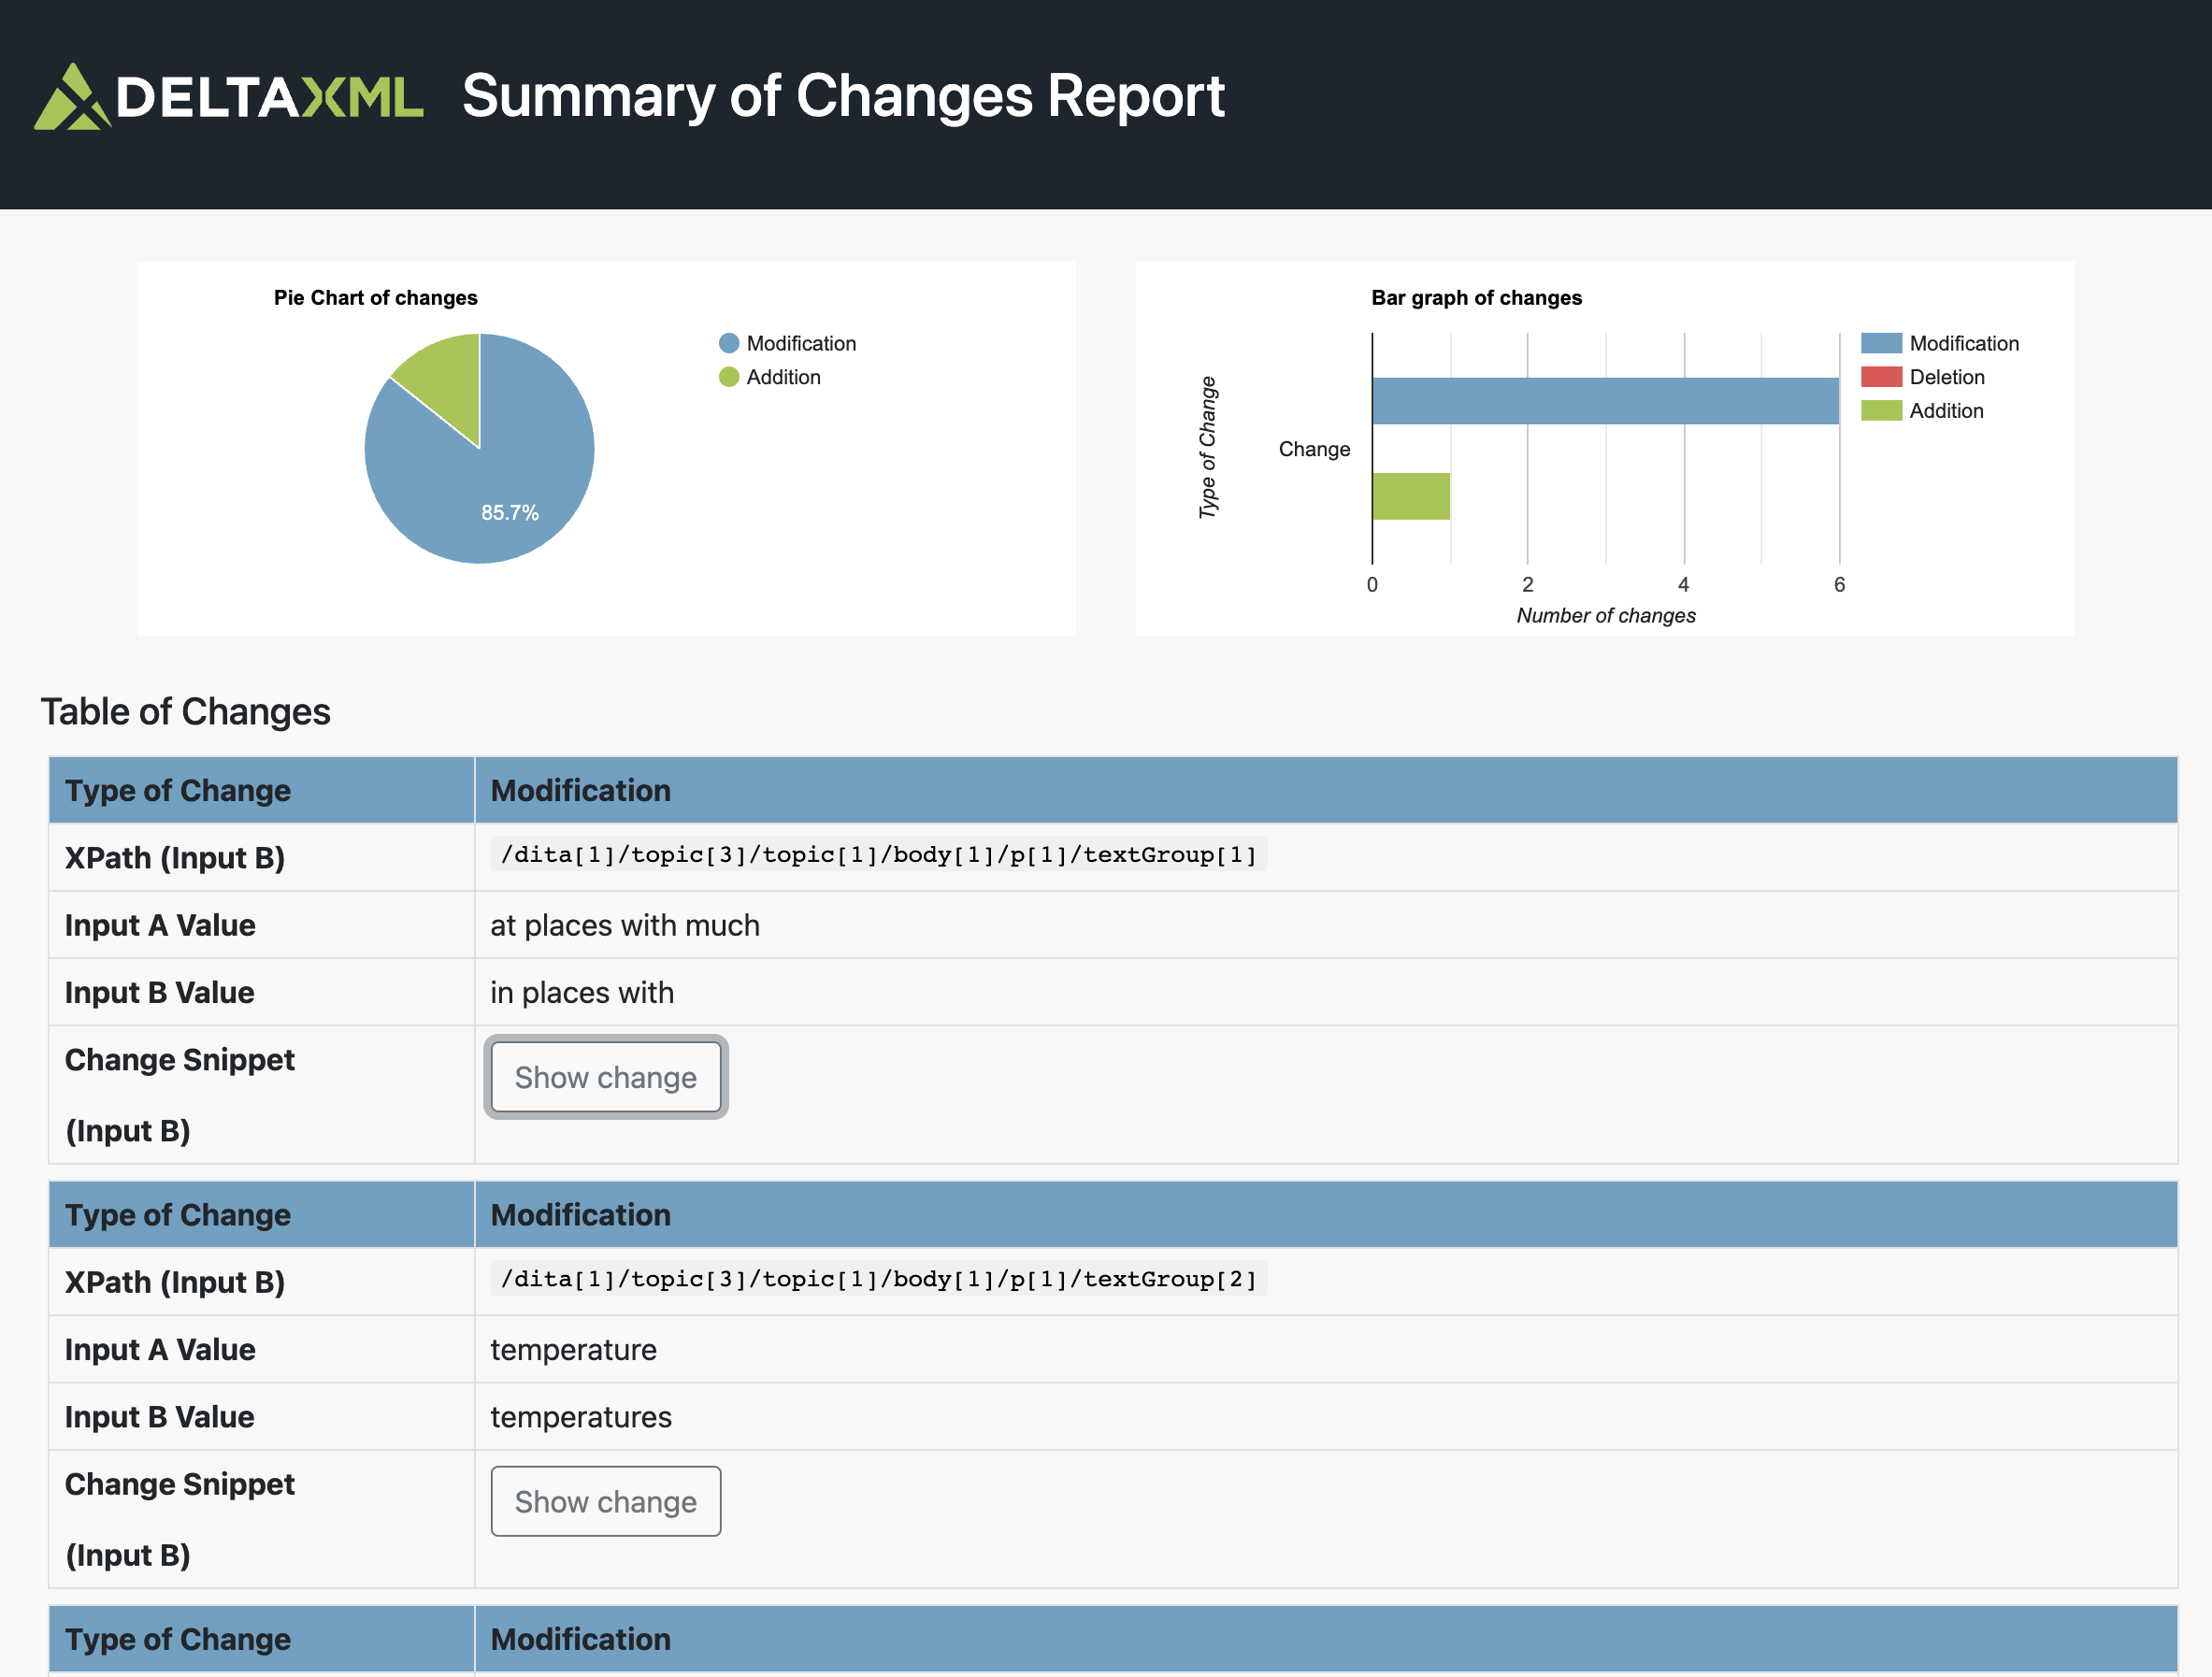
A Report of Multiple Modifications/Additions
Change Report Sections
There are three main parts to the summary of changes report. All parts use a common colour code for the three types of change detected; blue for modification, red for deletion, green for addition.
Change Types
Pie Chart
At the top left is shown a pie chart that gives a summary of the percentage of the three types of changes which are deletion, addition, and modification. This will only list the types of change that exist for the inputs.
Bar graph
At the top right a bar graph lists the number of modifications, deletions, and additions.
Table of Changes
Below the charts is a table of changes that gives more detail on each change.
There are five rows in the table for each change:
Type of change: insertion, deletion, or modification
The XPath of the change within the XML with respect to input B
Input A value
Input B value
The context of the change in DeltaV2 format