DocBook Compare 8.0.0 Tester User Guide
Table of Contents
Introduction
Comparing Tables in documents is tricky, there is a trade-off between trying to capture the structure changes in the underlying markup and showing the content changes as the User sees them. DeltaXML have been listening to our customers and have been working on a new approach to comparing Tables which emphasises the content changes in Tables as Users see them. This should avoid results where Tables are irregular and should better reveal finer grain cell content modifications. We also now have an output presentation which preserves the spans from one Version and shows content changes within those.
Improved table processing in 8.0.0 release
In this 8.0.0 release we have included our latest table comparison algorithms for CALS Tables. If you are using Docbook that means https://tdg.docbook.org/tdg/5.1/cals.table.html and https://tdg.docbook.org/tdg/5.1/cals.informaltable.html , in simple terms tables that contain <tgroup>s. The latest table algorithms are not yet available for HTML tables https://html.spec.whatwg.org/multipage/tables.html#the-table-element , i.e. tables with <tr> (such as https://tdg.docbook.org/tdg/5.1/html.table.html or https://tdg.docbook.org/tdg/5.1/html.informaltable.html ) or DITA simple tables https://docs.oasis-open.org/dita/v1.0/dita-v1.0-spec-os-LanguageSpecification.pdf p99.
In the following discussion we use ‘A' to mean the first version passed to the comparator and ‘B’ to mean the second version. Things only in ‘A’ are deletions and things only in 'B’ are insertions.
The old approach was roughly based on 2 techniques and stemmed partly from the goal that it should be possible to reconstruct both A and B documents from the result:
Keying cells according to the column to which they came from in sequence.
Where there were structure changes, such as a span in one input that’s not there in another, it’s not possible to show both A and B so the idea was to show separate A and B rows or even tables.
The new approach is based on different techniques:
Comparing the columns of a table first, based on the content that they contain.
Reconstructing a non-ragged table showing column and row adds and deletes but basing the final structure on that of the B input. So we are losing some information about the A structure in order to show changes at a finer granularity. So, for example, where a B span merges what were individual cells in A it will not always be easy to tell which A values came from which columns. A and B values will not however be lost.
What types of difference can I expect to see? Our previous approach to Table comparison is discussed at https://docs.deltaxml.com/support-and-documentation/latest/comparing-document-tables-cals-or-html with the examples at https://docs.deltaxml.com/support-and-documentation/latest/examples-of-table-comparison-results, so let's see what the new algorithms give us in these cases. In the following screenshots deleted cells are shown in red, added cells are shown in green. Deleted text will be shown in red and added text in green. The input files and pipeline can be found on bitbucket at https://bitbucket.org/deltaxml/cals-tables/src/master/
For simple cases like modified values in cells or non conflicting row or column changes (Examples 1 to 3 in the linked to documentation above) there are no differences.
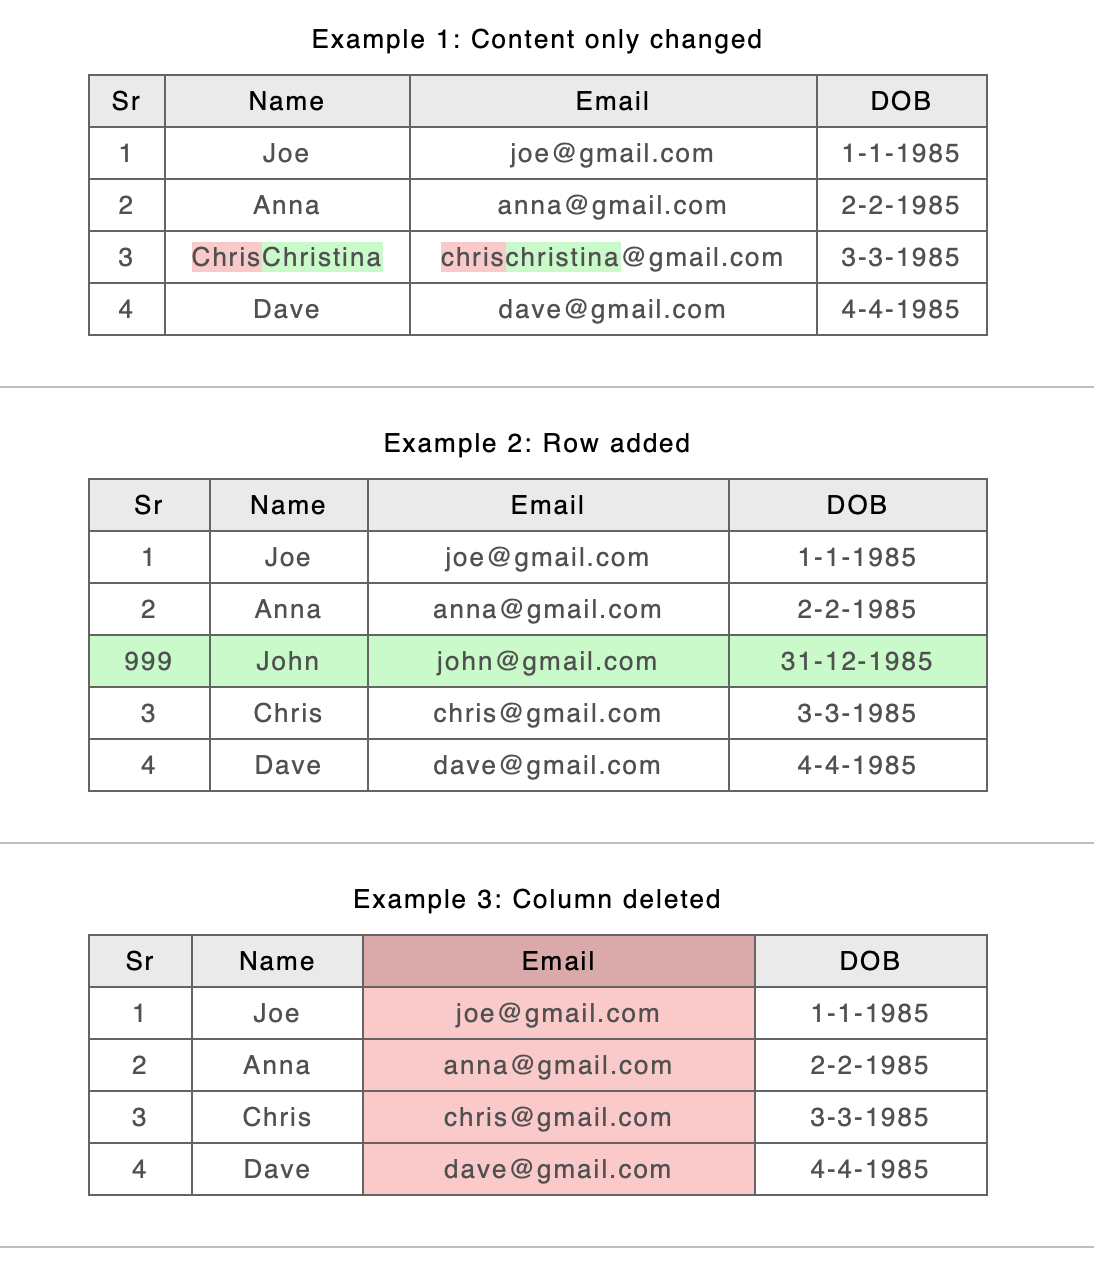
For ‘row level’ changes where the old algorithms split rows into A and B versions, the new algorithm now shows the result using the B spans.
Old
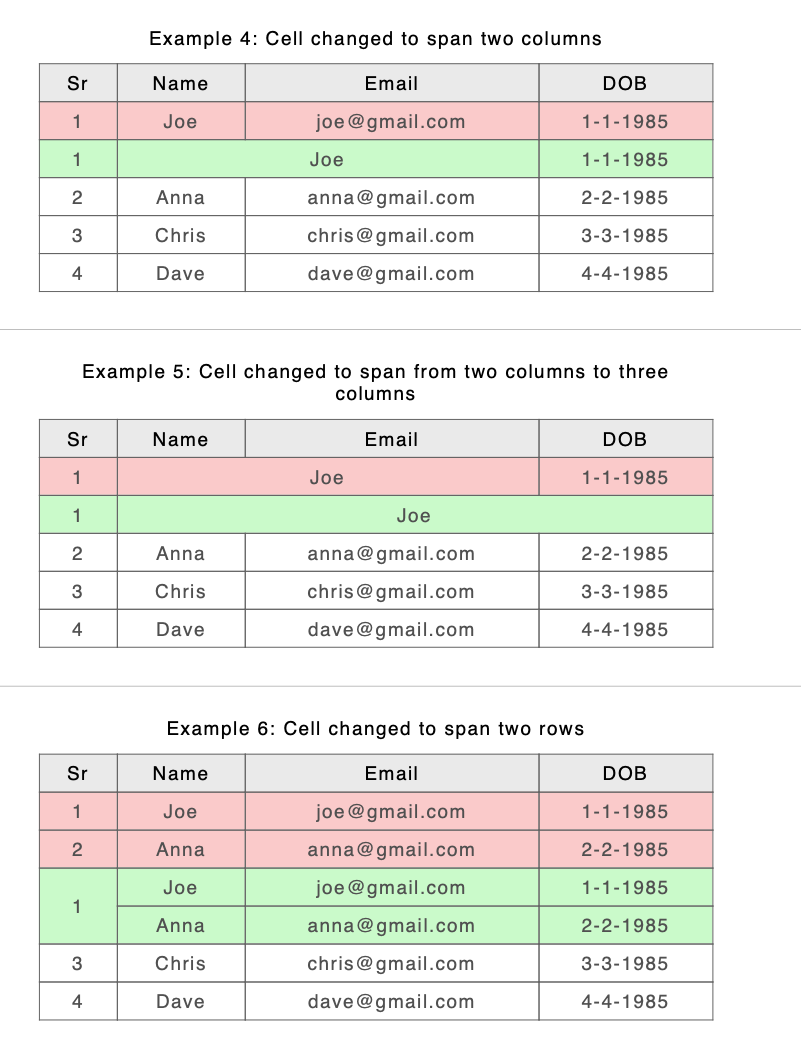
New
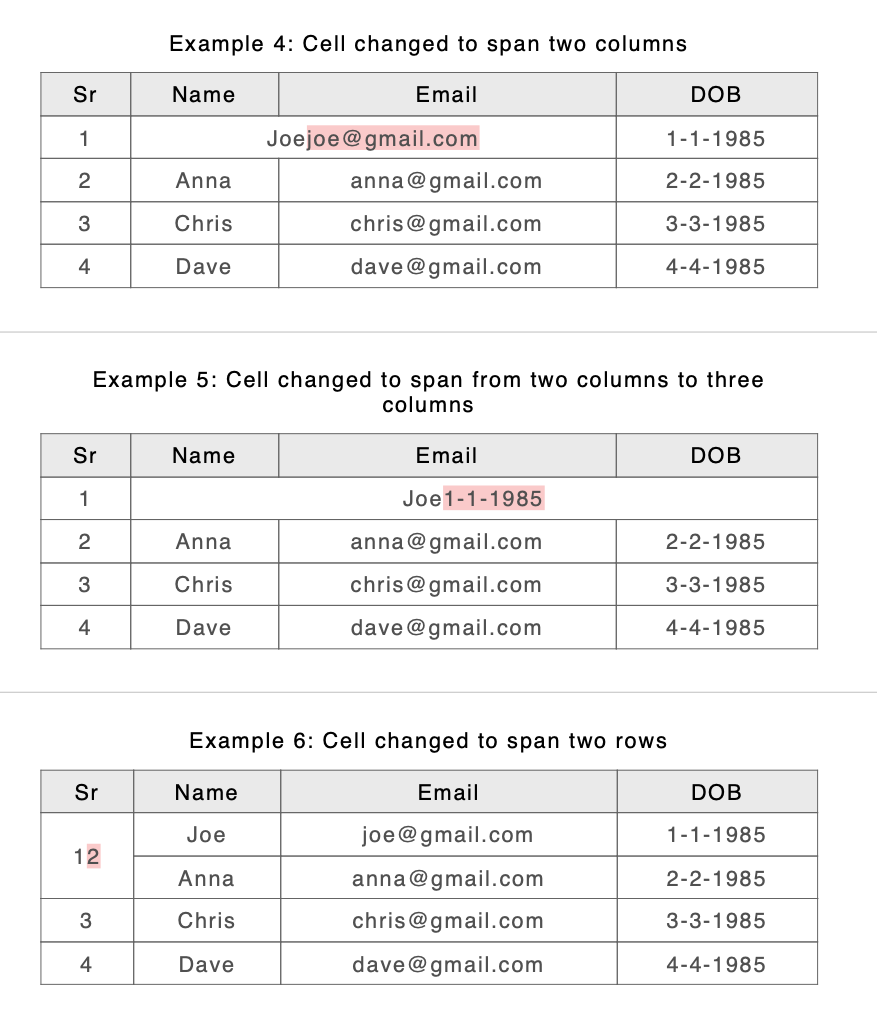
So the new approach where there is a spanning conflict is to keep the B span or structure. What happens to the A content where a B span covers up what were several separate cells with different content in A? Let’s have a look at Example 10 from https://docs.deltaxml.com/support-and-documentation/latest/examples-of-table-comparison-results. Here are the files before comparison
Version 'A'
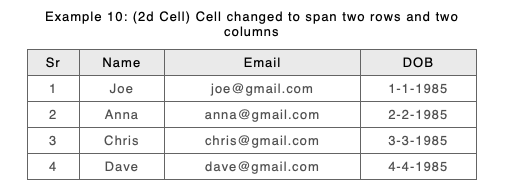
Version 'B'
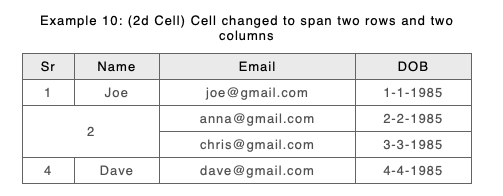
and here is the result from the old and new algorithms
Old
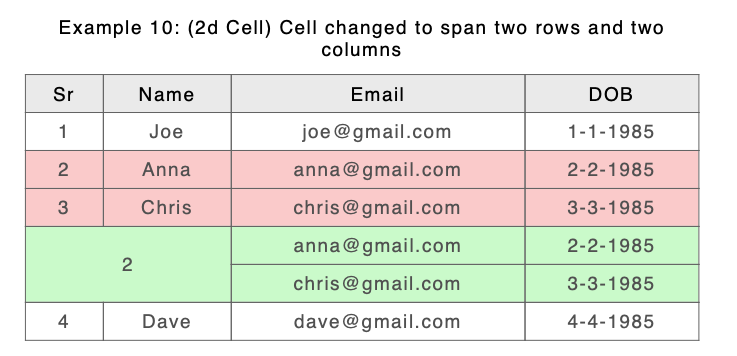
New
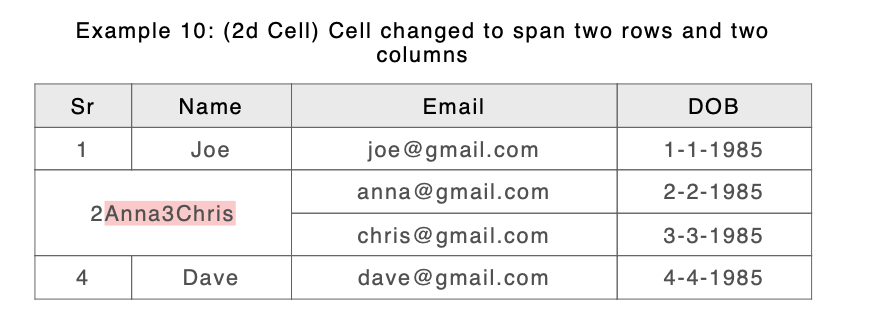
Because 4 cells in A (the first 2 columns of the second and third non header rows) have been spanned in B by a single cell we have 4 sets of content from A to compare with 1 set of content from B. How do we show this? Currently we are choosing to compare contents of the ‘top left’ cell in A with the contents of the span in B and then append the rest of the content from the other A cells in 3 text groups. For those familiar with the raw DeltaV2 format it looks like this
This may not be the preferred result for everyone in all cases, so we are hoping that you will let us know what you would like. That is part of the point of the Alpha.
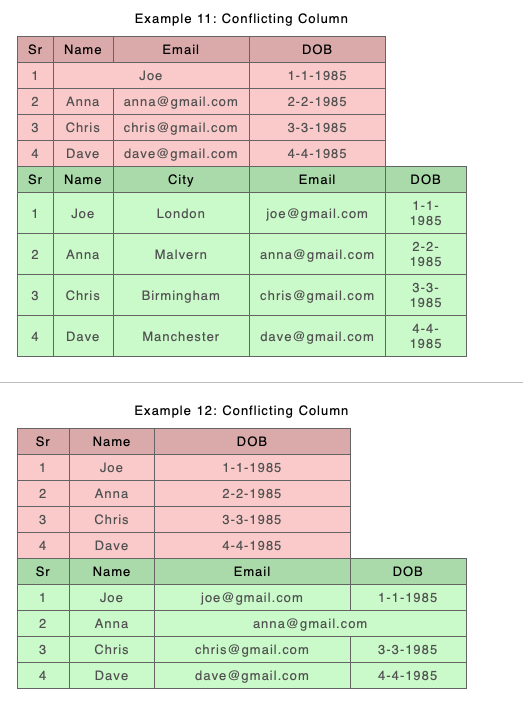
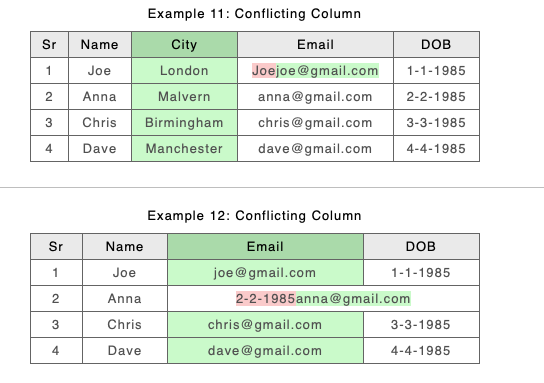
The old approach was chosen because of problems like this, but it’s clear that when there are minor spanning changes across many rows separating out A and B rows makes it difficult to identify content change. The new approach should make this easier. Take a look at the above example if we modify Anna’s email address:
Old
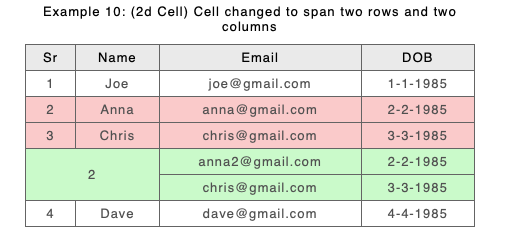
New
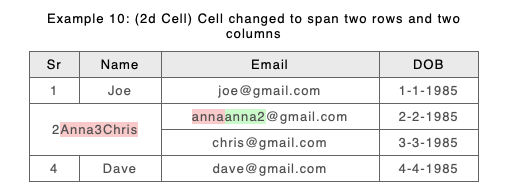
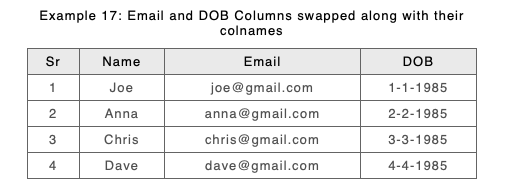
The old approach based on XML structure and keys tried to preserve information about changes to colnames which meant it erred on the side of caution in some cases where the order of columns had been moved around, and clearly if colnames had been changed it could lead to incorrect results.. The new approach emphasises content over XML markup. It looks into the values of columns and makes a choice on matching them based on a probabilistic analysis. This means it is not so sensitive to things like colname changes. In this example the old approach degrades to comparing columns by position, whereas the new approach can see that a column has effectively been moved.
Version 'A'
Version 'B'
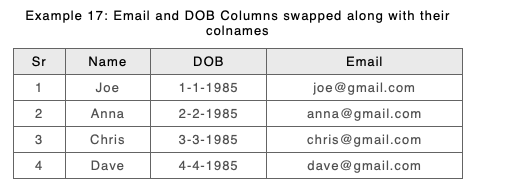
Old
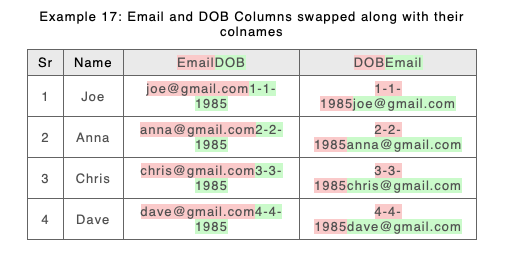
New
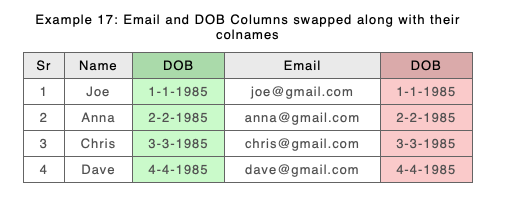
When things get more complicated such as span changes which intersect column insertion or deletion the old approach chose to show separate tables (or more accurately tgroups). The new approach with its combination of column content analysis and reconstructing B spans can show these changes in much finer detail.
Old
New
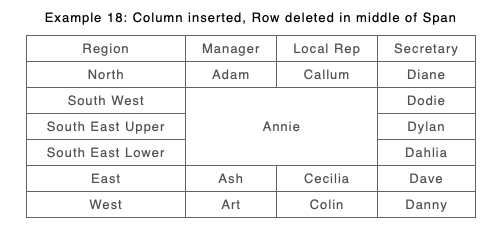
The new approach is good at coping with quite complex structure change, such as combinations of column moves and row additions and deletions along with span changes.
Version 'A'
Version 'B'
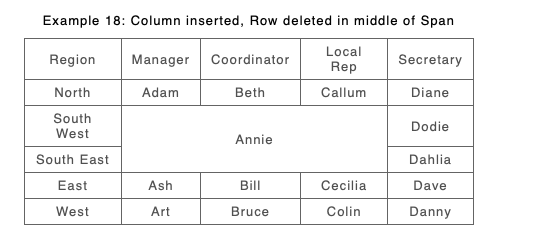
Old
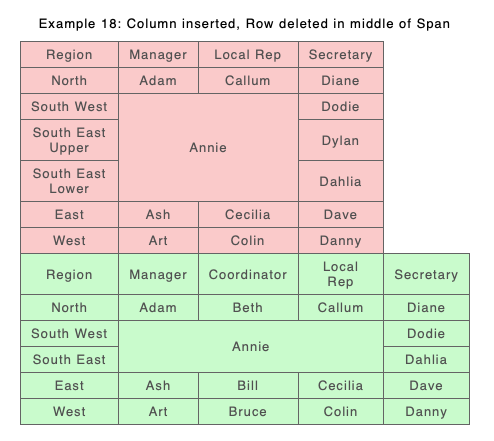
New
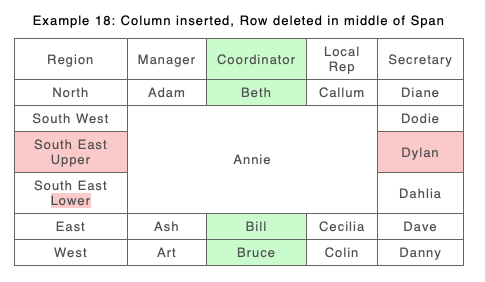
Differences will also be seen in the way that metadata to do with spanning such as colspec elements and namest/nameend attributes is handled. Because the new algorithm concentrates on constructing a correct table based on the B structure and showing changes within that, the result of the output table processing will lose some meta information from the inputs. For example colspecs will be reconstructed using the B version except where columns have been deleted, when the A version will be used. So A information will be lost. The values for attributes like namest and nameend which describe spanning need to be made correct with respect to the new colspecs and the actual values from A and B will be lost. If you wish to reconstruct tables in a different way, you will find the information is still available in extension points before the output table filters.
New Column Alignment Features
The new table alignment algorithm uses a different approach for aligning columns in compared tables to detect if a column has been added, deleted or moved.
‘Ordered’ and ‘Orderless’ Table Columns
By default, columns alignment by the comparator is ‘ordered’. That is, in two compared tables, columns are aligned such that the order of columns in each table is regarded as significant.
In many, if not most, types of data table, column order is not significant. Column headings identify columns such that if the column position changes, the meaning of the the table does not change. We describe such tables as having ‘orderless’ columns.
Column Alignment
Column Keying
A processing instruction <?dxml-column-keying-mode auto|colname|position?> should be used inside tgroup element to apply the column keying mode. User defined column keys can also be applied using the processing instruction <?dxml-column-keys "One, Two, Three, Four,"?> within the tgroup element where comma separated list identifies the columns.
Orderless Columns
The order of columns after any ‘header row’ may not be important to you and you may wish to see the differences to cell values in columns rather than the fact that the whole column has been moved. A processing instruction <?dxml-orderless-columns?> should be used inside tgroup element to ignore the column order.
As an example consider a modified Example 17 (from above) again DOB and Email have swapped positions, and this time we have modified Anna’s date of birth:
Version 'A'
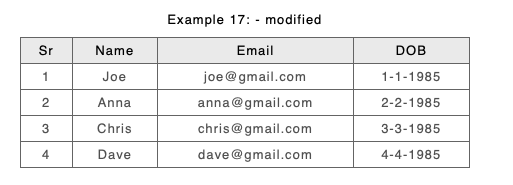
Version 'B'
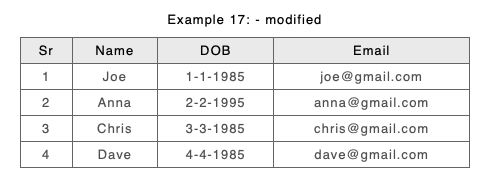
New with ordered columns
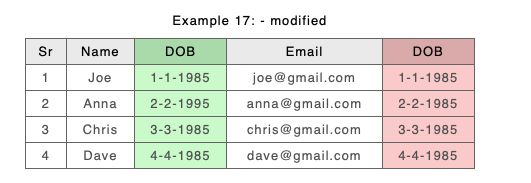
New with orderless columns
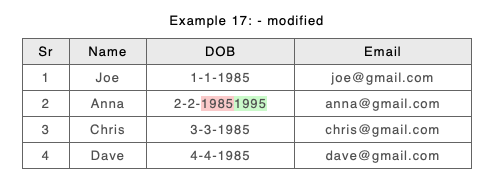
What should I do to best exploit the new algorithms?
As an experiment you could remove any filters you may have been using to tweak table processing results to see how things look now.
Things you might want to tell us about
Before you rush to email us, please try it out. How does it work with your data? As always we love to see your examples. Maybe you can’t send us your data without anonymising it. Our anonymiser might help with this. Because the new approach uses probabilities based on PCData value frequencies simply preserving the structure and filling it with Lorem Ipsum will not work.
Can I preserve the A structure instead of the B structure?
For now your only option is to swap the order in which you pass the files to the Comparator, but let us know if you would like this.
I don’t like the way that B spans stretch across deleted columns or rows
The decision to show B spanning cells that are only effectively in A was taken to “preserve” the look of B. This works well where effectively the B span is is the same as the A span except where the deletions occur. In another case the B span stretches across different cell and span values in A. In this case the deleted content from A will appear in the B span and the result is more complex to understand. We could choose to fragment B spans where this happens, but we found that that also created hard to follow results. Let us know what you think.
As an example consider the following story. An organisation removes ‘Coordinator’ and ‘Local’ roles from their spreadsheet (column deletion) and also removes separate roles for the UK (row deletion). The new approach shows the deleted cells from A. However in the reshuffle Adam now takes over the roles of Secr’tary of US and Manager and Secr’tary of Africa (new Span in B). He takes these over from Diane, Art and Danny, so the result span shows these deleted values as well as Adam. However because the new B span stretches across the deleted UK rows and the Coordinator and Local columns it also includes A’s values from those as well, UK, Benjamin, Dodie.
A

B


I don’t like the way that A content is just appended without any visual effects if multiple A cells contribute values to a B span.
In example 10 above the result table shows a Cell with ‘2Anna3Chris’ with ‘Anna3Chris’ being content from over-spanned deleted cells. This is wrapped in our deltaV2 markup and you could choose to style it differently. How would you like to represent it?

I’d prefer structure changes to result in separate A and B rows or tables like before
The old approach showed example 10 like this

you might find that preferable if all your changes are limited, but where it runs to a large number of rows we found it difficult to see what content had changed.
Some tables are better with the old stuff and some better with the new
We’d like to hear. If you have examples that would be great.
Validation
We validate the CALS tables as we did using the previous approach. The validation currently “tells” us what a table is (Comparing Document Tables (CALS or HTML) - Detecting Table Types ).
Do you like it? Do you want a more accepting approach?
Known limitations
Empty tables or tables with little significant data in
One current weakness happens when tables are empty or contain data that is heavily repeated across columns. Because the new approach analyses content when comparing versions it does a bad job in these cases.
This is a problem we are currently working on.
In these cases for now you can use the Column Keying as described above because an empty table is mostly just structure. The same approach can be used with heavily repeated data.
To see what I mean let us consider the case of 2 empty tables above a certain size but with non content differences such as colspecs;

They both have 2 rows and 7 columns. The result

Will have 4 rows and 14 columns because none of the columns have matched and so neither row matches.
The same could happen if the table cells were filled with more or less the same data like Lorem Ipsum.
Small tables with many hidden columns or tables with adjacent columns whose data is much the same
Another current weakness happens when a table has many columns that are hidden by spans. Typically this is where Users are using columns to format the alignment of cells within tables. When one item of content spans several columns there is an issue about how to assign this content to the columns and this can cause column alignment issues in some situations. The same can occur when tables consist of mostly the same data.
This is a problem we are currently working on, but for now you can use the Column Keying as described above if you already ‘know’ the alignment.
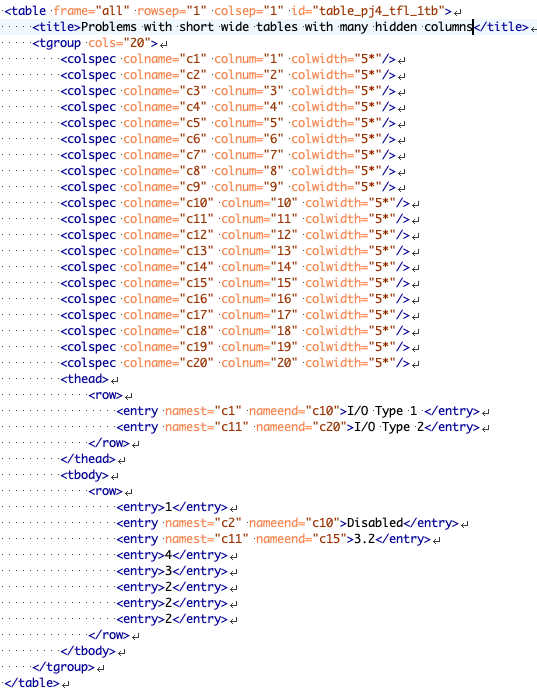
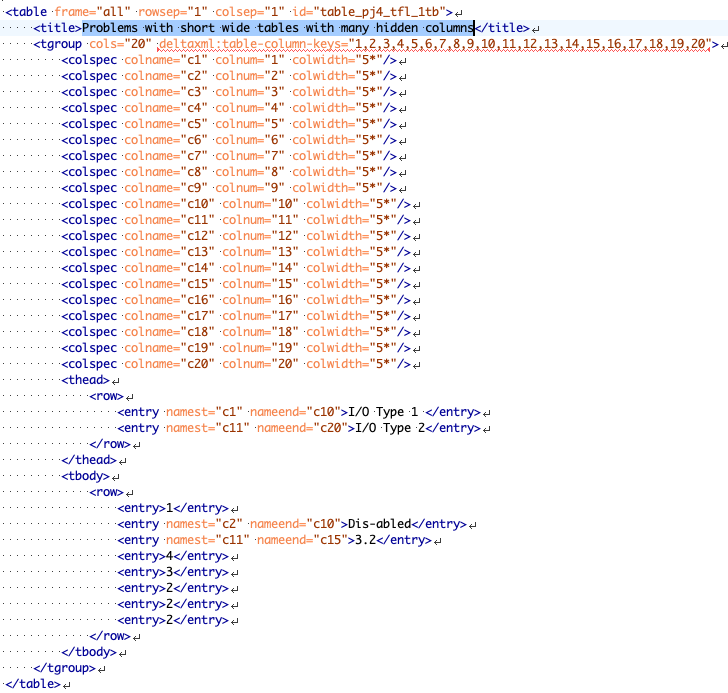
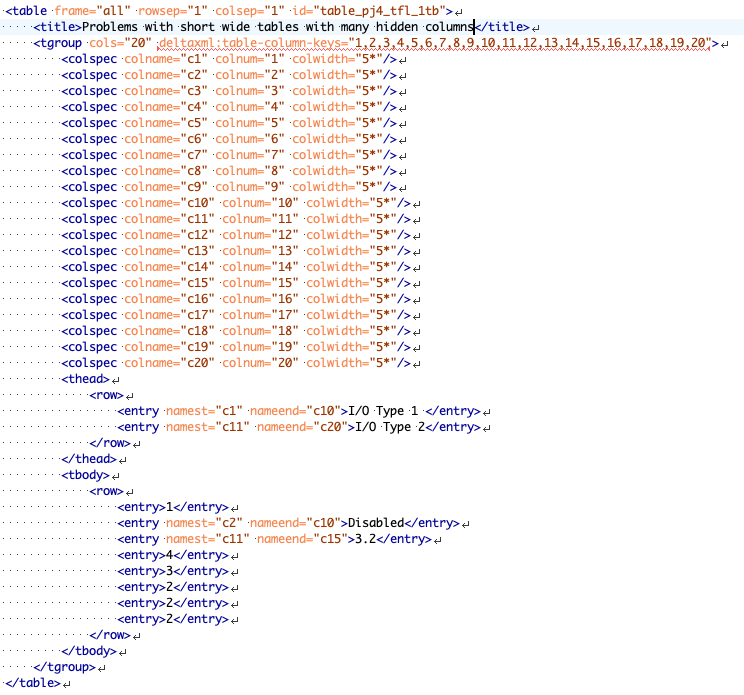
Consider the following 2 inputs shown with their underlying XML. You can see that they actually have 20 columns each whereas they only appear to have 8. They are more or less the same file except that B has changed the text ‘Dis-abled’ to Disabled.
A

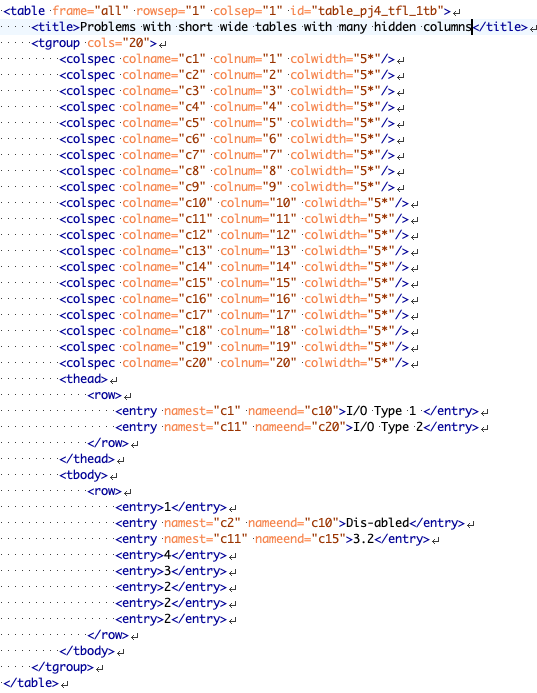
B

The result of a comparison of these using the new approach gives the unsatisfactory output below.

By adding Column Keys to the XML (you can do this automatically using the parameter described in Column Keying above) you can effectively produce the following XML, which gives a better result (see below)
A
B

spanspecs
We have not yet completed work on spanpecs. Whilst they are taken into account when reconstructing the spans in the result, we don’t yet preserve the link between the spanspec and those entrys via the spanname attribute. It is replaced in the result with equivalent namest and nameend attributes. This means any style information attached to the spanspec, like the align attribute value will be lost. Let us know if this causes you problems, but remember that we can only ever use one style (currently the B style) to reconstruct span styles.
colspecs in thead and tfoot
tgroups define the number of columns that the tbody, thead and tfoot elements may contain. But thead and tfoot may define (though not in the CALS XML Exchange Table Model Document Type Definition) different styling for those elements using their own colspec elements. If the colspecs in the thead and tfoot have different names from the tgroup colspecs then those names will be used when reconstructing the table, as with tgroup colspecs mentioned above, the B colspecs will be used except where there are columns only present in A.
performance
This is an alpha and we wish to get User feedback on what Users think about the results. We are awaiting these before making a concerted effort at performance improvement. However we welcome and are interested in feedback about performance as well.
Terms and conditions
A alpha (pre-release) software that is given out to a group of users to try the new functionality. This alpha version have gone through alpha testing in-house and fairly close in terms of function to the final product. However, design changes may occur in the final release.
